


This article usually requires a Devex Pro subscription to read, but we made it free for you so you can get a taste of the exclusive insights and deeper analysis we provide our subscribers. Get unlimited access to Devex Pro by becoming a subscriber. You’ll be supporting a team of global journalists reporting on the forces shaping global development to help you get ahead of the news, trends, and conversations. Try Devex Pro for 15 days for free.
You can read more on this topic in these articles:
► The top 5 climate donors
► How climate change and gender-based violence are connected
► How a new $100B green energy alliance will work
At the United Nations Climate Change Conference in Copenhagen, or COP15, a decade ago, high-income countries pledged to raise $100 billion annually for climate mitigation and adaptation action by 2020. Fast forward 10 years to COP25 in Madrid, heads of state and climate advocates from around the world are continuing to apply pressure to increase climate funding — but the goal from the beginning of the decade has not been achieved.
At every climate conference, nations leading the fight against climate change reiterate the importance of climate action and financing for a sustainable future, but are these speeches and commitments reflected in funding reported?
To find out, the Devex Analytics team dives into the five years of climate-related funding data, 2013-2017, from 85,000 projects totaling approximately $177 billion. Read on for insights from our Analytics team on trends in recipient locations, funding volume, sectors of funding, and prominent projects.
Tapping into OECD data
One comprehensive data source on environment and climate funding is the Organisation for Economic Co-operation and Development website. As a main go-to source for official development assistance figures, it has continuously expanded the complexity and depth of reported aid flows to include additional insights.
Since the Rio conventions in 1992, OECD has added the so-called “Rio markers” to its data to reflect the share of ODA going toward five areas: environment, biodiversity, climate change mitigation, climate change adaptation, and desertification.
Although the reporting of the data finding figures is voluntary, all Development Assistance Committee donors are now submitting ODA reports with an assessment of Rio markers — with a few additional countries such as Hungary, which started reporting on Rio markers in 2016, as well as Poland and Slovakia, starting from 2013. It is worth noting that several international institutions — such as the World Bank and the United Nations — are not included in this analysis as they are not DAC donors.
Explore the climate funding data
Explore five years of climate funding data, put together by the Devex Analytics team, in this interactive visualization.
The way in which Rio markers work is that development projects reported to OECD are assigned a score, depending on their relevance to the five markers. The official OECD methodology bases the score on the following question: “Would the activity have been undertaken (or designed that way) without this objective?”
If the answer is yes, it means the connection between the project and the Rio marker in question is significant. However, if the answer is no, then it is tagged as “principal,” meaning that the sole purpose of a given project is targeting either of the markers. There is also a possibility that some projects are simply not related to either of the Rio markers, in which case the score is 0, or they are not weighted against the Rio markers, thus the total numbers could be much higher in reality.
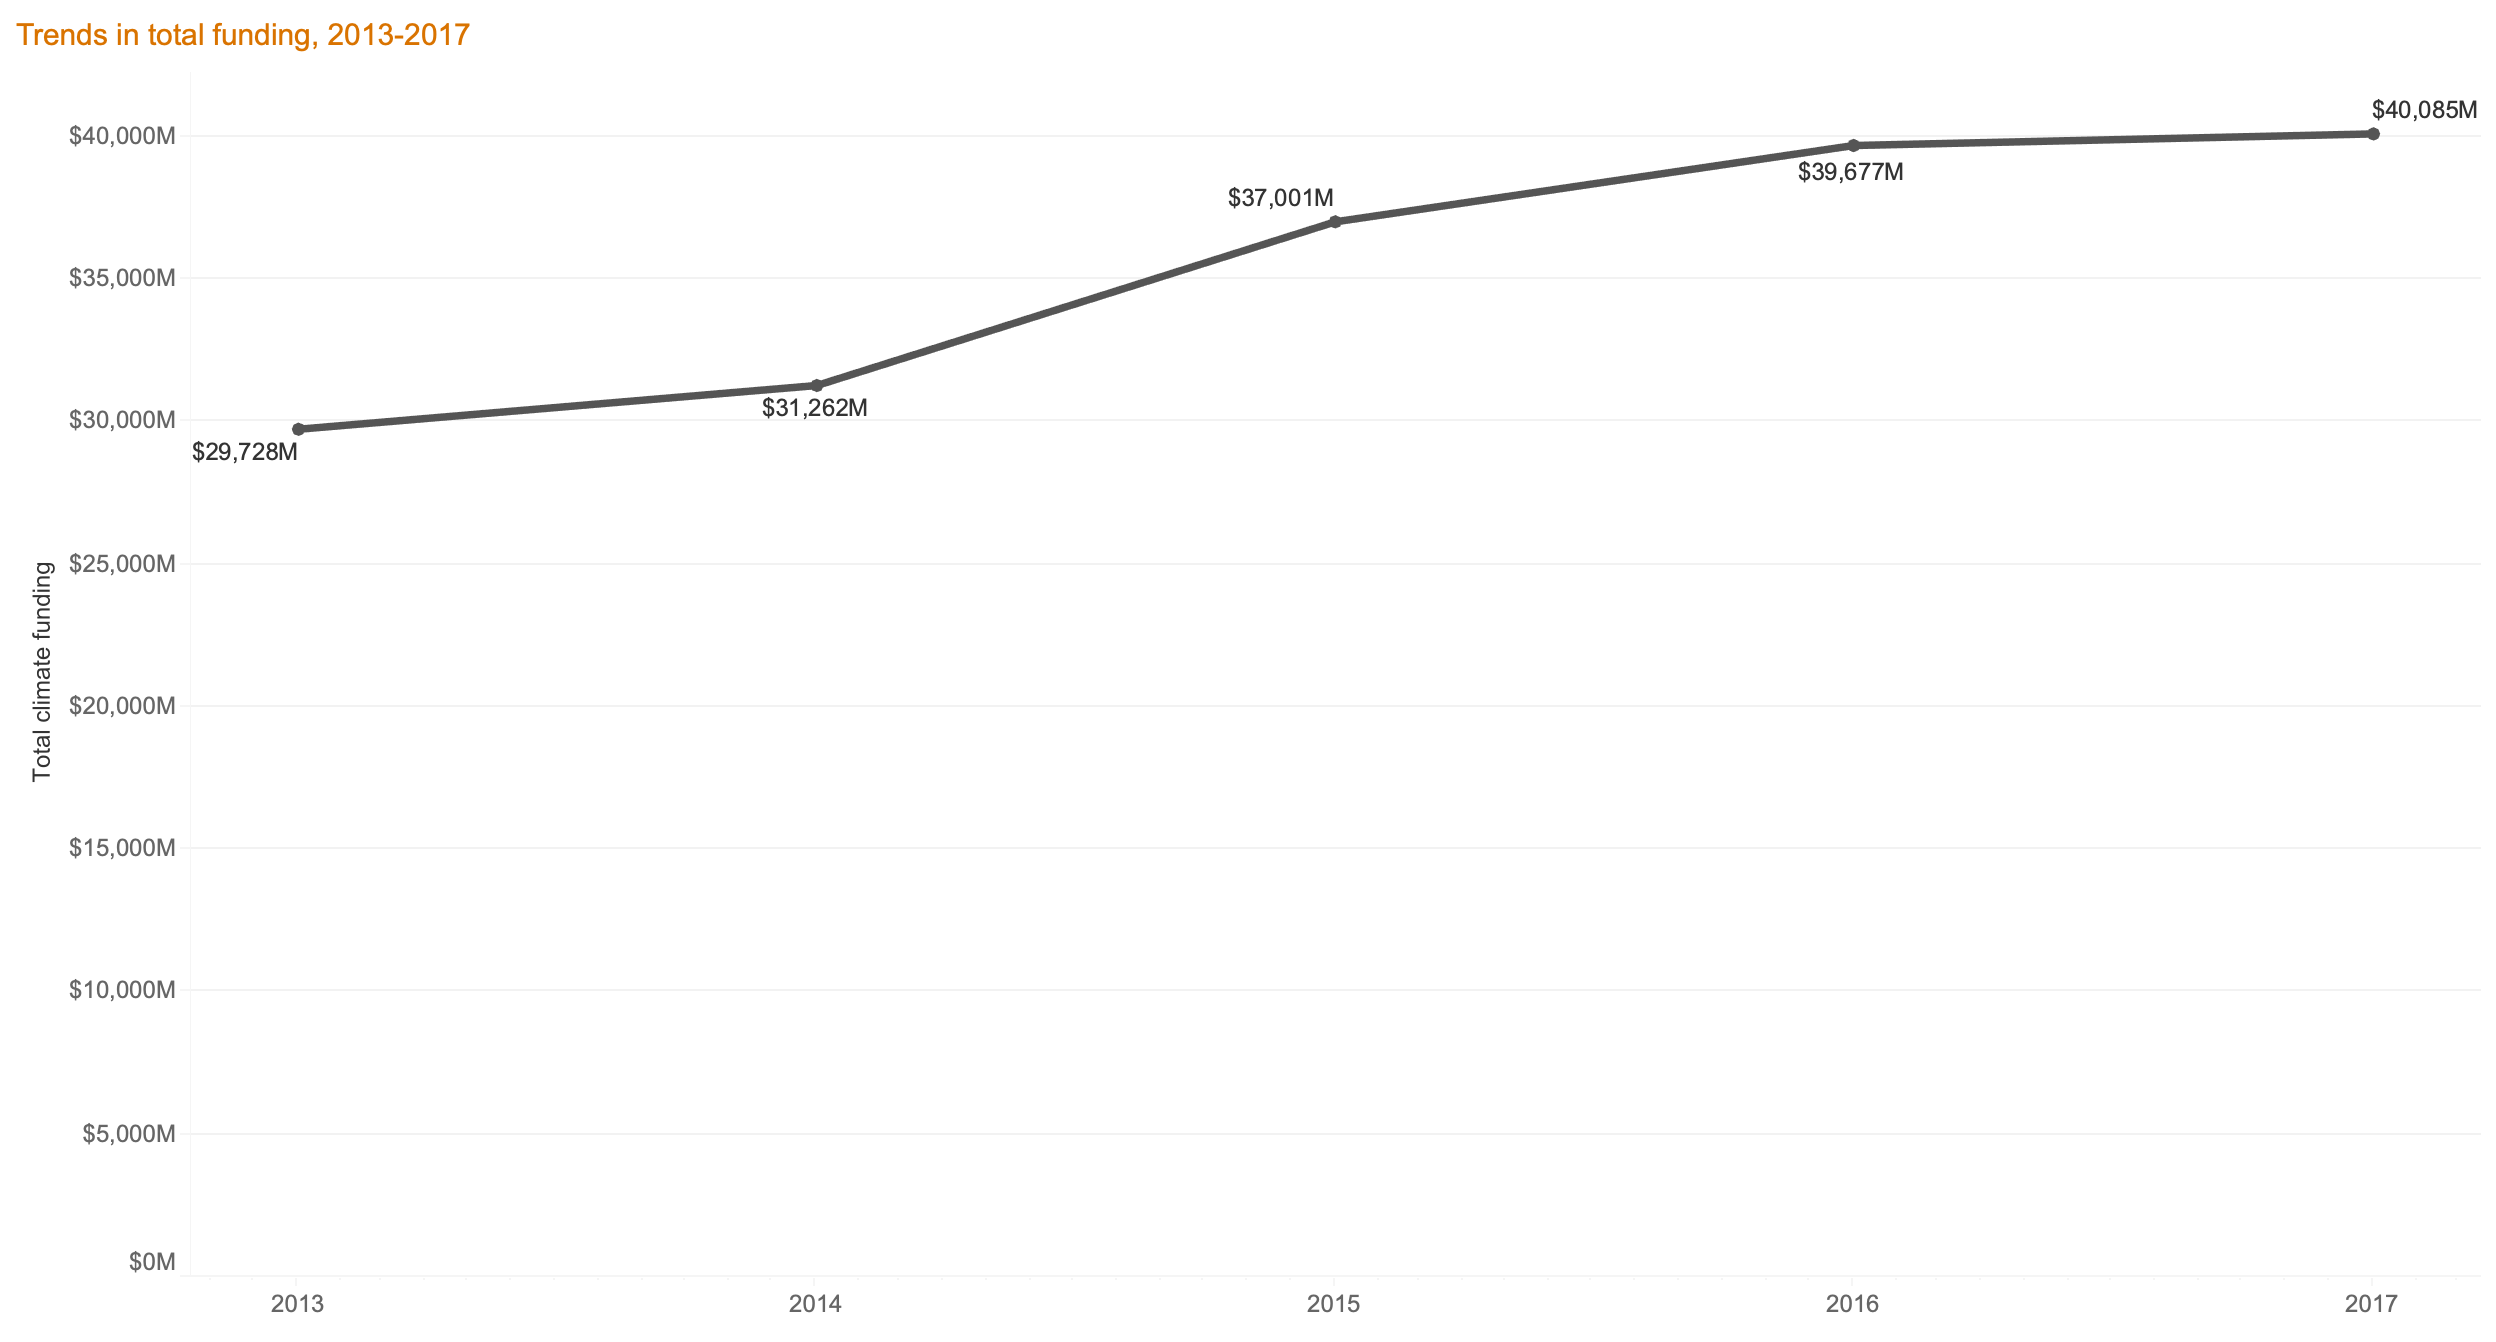
Climate funding on the rise
Whether due to increased aid transparency or higher commitments by donors, total reported funding going to either Rio marker has more than quadrupled since 2002.
This article assesses primarily the years from 2013-2017 for a more manageable scope, but the data stretches back to 2002. Back then 23 countries reported a total of $7.7 billion in climate funding. In 2017, the most recent year with data available, this number has increased to around $40.1 billion, as reported by 29 donors. The most significant increase, however, took place between 2009 and 2010, which had an over 40% increase.

Surprisingly, climate funding has not observed a big jump post-Paris agreement in 2015. Funding between 2016 and 2017 only increased by 1%, despite a strong momentum for climate action in recent years.
Next year, when the 2018 figures are released, we’ll look again for stronger increases, which could be caused by the climate strike initiative, started by climate activist Greta Thunberg in August 2018, and an overall increase in pressure by the international community.
Recent 2019 funding announcements and pledges — from the United Kingdom’s controversial new climate change and biodiversity funds worth £1.3 billion ($1.7 billion), to Australia’s newest climate change action strategy pledging $500 million Australian dollars ($343 million) for the 2020-2025 period or France’s pledge to invest €5 billion ($5.5 billion) in climate financing by 2020 — seem to indicate we should be expecting important increases in the reported climate funding flows in upcoming years as well.
Which countries put their money where their mouth is?
Japan has been a consistent top donor according to the OECD data, despite receiving a grade of “highly insufficient” in meeting the Paris agreement’s 1.5 degrees Celsius limit, according to the Climate Action Tracker, and getting rejected as a speaker at the U.N. Climate Change Summit earlier this year. In 2017, Japan’s reported funding toward the Rio markers reached nearly $10 billion, which is a quarter of the total funding across the 29 donors for that year alone.
Trailing behind, Germany comes second with a total of $8.4 billion committed funds and the EU institutions come third with $6.7 billion in 2017. The United States, with around $2.5 billion is ranked fifth in terms of committed funds in 2017, however it has the highest number of projects — 3,412 — compared to Japan’s 1,416.
The bottom three donors in terms of committed climate funding is Slovenia, Slovakia, and Greece, with less than $5 million reported funding in total, which could be attributed to overall low ODA levels.
The data also breaks down the countries’ respective agencies responsible for managing and disbursing climate funding. In many cases, the ministry of foreign affairs plays a significant role in climate funding — for example in Finland, Ireland, and the Netherlands, among others. But there are also donors with a more decentralized institutional landscape, such as Germany with an overall 26 different agencies, and with two — Bundesministerium für Wirtschaftiche Zusammenarbeit and Entwicklung and Kreditanstalt für Wiederaufbau — holding the vast majority of climate funding.
Where is the funding going?
Explore the climate funding data
Explore five years of climate funding data, put together by the Devex Analytics team, in this interactive visualization.
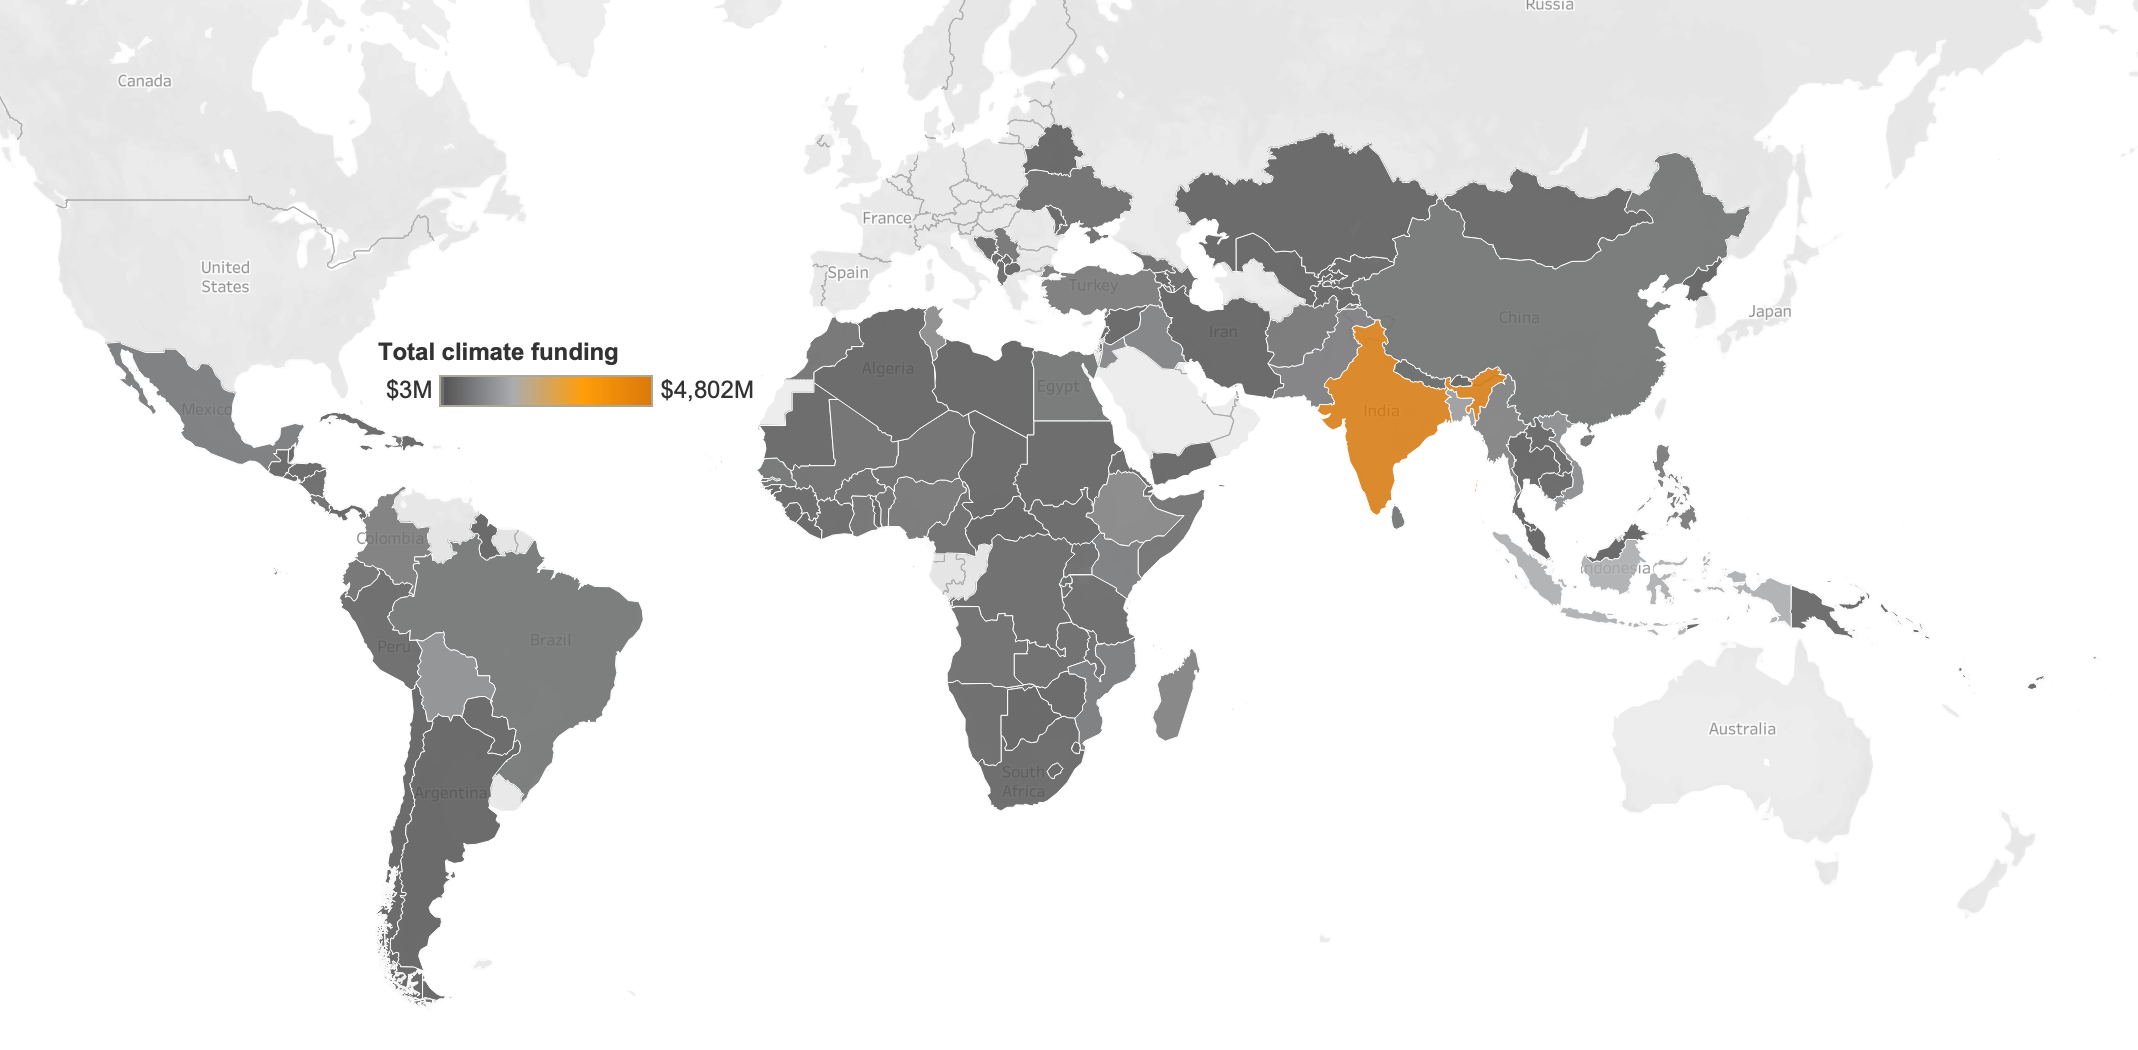
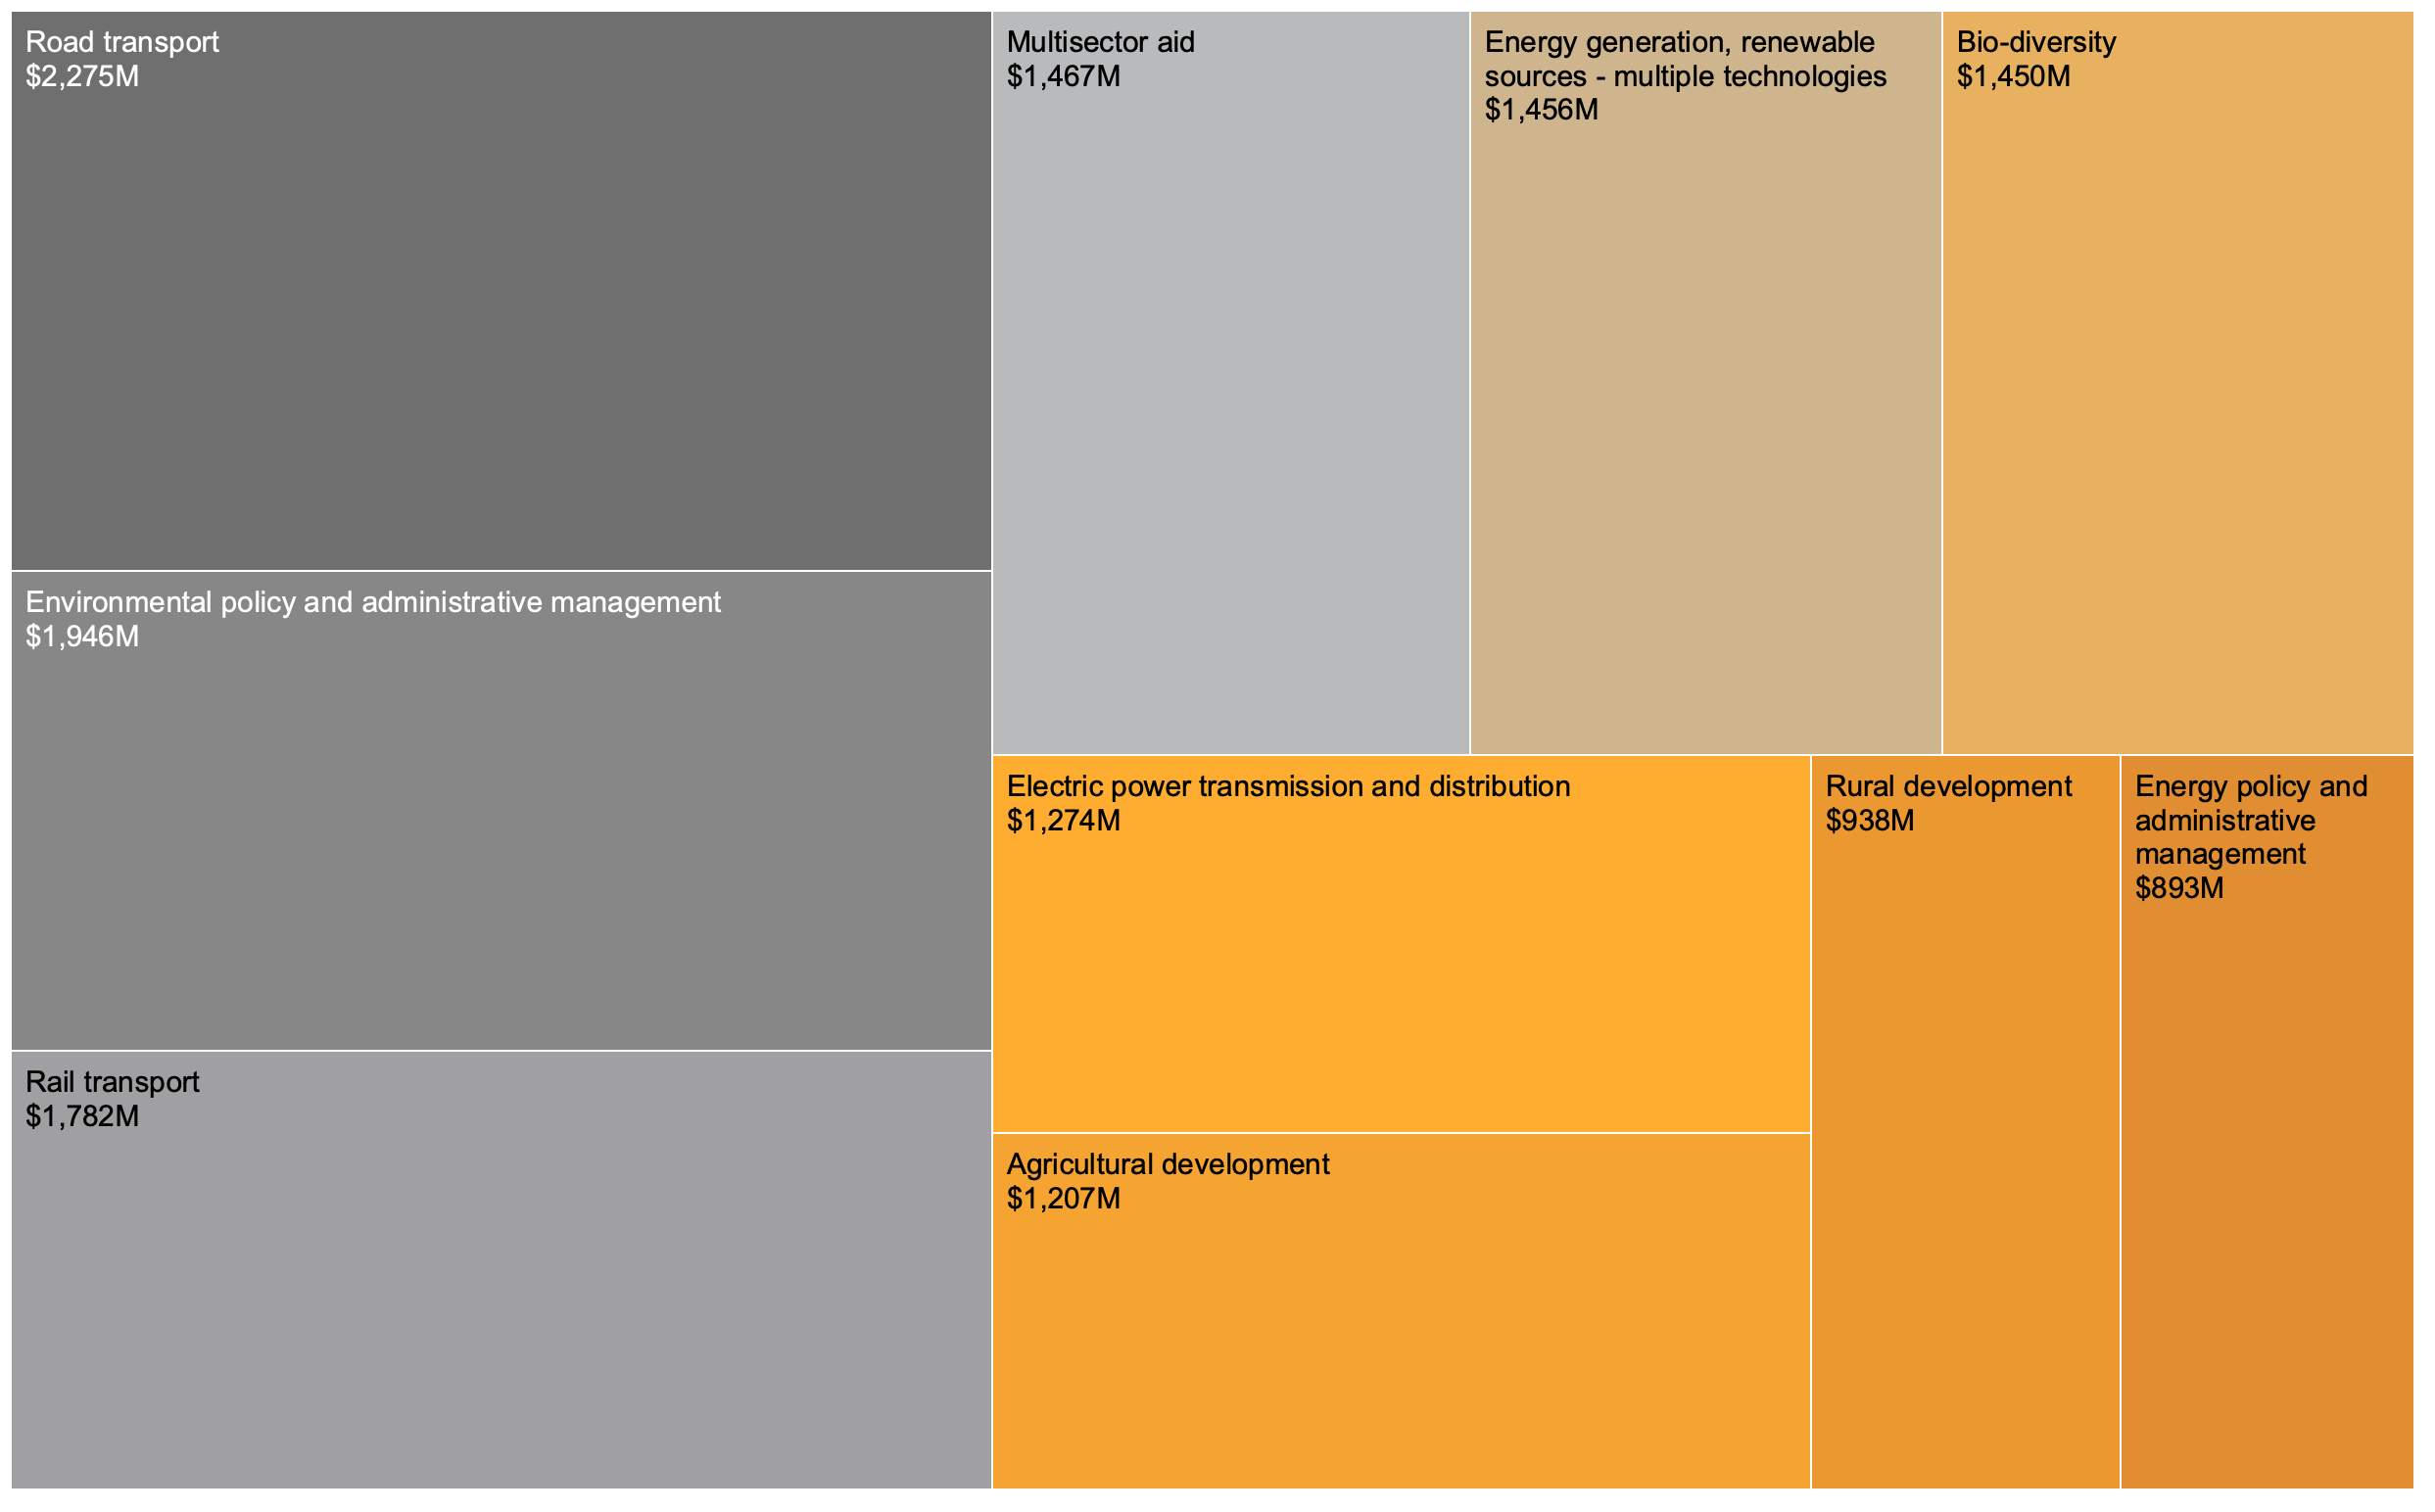
With a whopping $4.8 billion of received funding in 2017, India is leading the pack of recipient countries. Japan is responsible for nearly 80% of the total inflows to the country, along with Germany and France.
A large share of the high funding amount is attributed to a variety of projects targeting connectivity, reflected in the main reported purposes such as rail transportation, road transport, and electric power transmission and distribution. Some of the largest projects, in terms of committed funds, are Mumbai Trans-Harbor Link Project, North East Road Network Connectivity Improvement Project, and Chennai Metro Project.
In the past five years, analysis shows that India has been the top recipient country in all except for one year — 2015. That year, the Philippines experienced a peak in its funding, which reached approximately $2.6 billion, primarily funded by Japan alongside France and the U.S.
Similar to India, the main stated purpose of the funding was rail transport, with a small portion of funding going toward flood prevention and control, as well as road transport. The largest project in the Philippines for that year is, in fact, the North-South Commuter Railway Project, which aims to build a new railway line around Metro Manila and the province of Bulacan, just north of Metro Manila.

Beyond the bilateral commitments, the OECD data also includes region-wide no-country-specific funding.
For instance, in 2017 alone, a category for unspecified low- and middle-income countries received $6.3 billion, which in most cases covers untied aid for organizations working across different regions. Some of the biggest donors in this category were Germany (with $1.5 billion committed funds) and the EU institutions (with $1.4 billion). Japan, on the other hand, has only committed $30 million in this category. In 2017, the overall ratio between funding to regions vis-à-vis countries was roughly 1:4, where the total funding allocated across the 17 regions reached $10.5 billion.
Which markers receive the most attention?
Between the five markers — environment, biodiversity, climate change mitigation, climate change adaptation, and desertification — the environment marker is the most prominently used, as it is also the earlier marker to be applied and captures a wide variety of projects, due to its generic definition.
In 2017, more than three-quarters of the total funding was classified to have either significant or principal relation to the environment. Where the relationship was principal, meaning the project would not have been implemented had it not targeted environment specifically, the top three recipient countries were India ($538 million), China ($348 million), and Egypt ($308 million).

Since projects can be tagged under several markers, it is advised not to add the totals for each marker — however, the data can be used to understand the relative weight of applied markers to projects. For example, more funding is targeting climate mitigation as opposed to climate adaptation, where the former focuses more on rail transport and the latter on agricultural development.
Biodiversity has also recently become a prominent marker with increased funding being classified under it, for example in 2017, when a total of around $8.8 billion worth of projects were either significantly or principally related to biodiversity.
Desertification, perhaps the least tagged Rio marker, has a strong presence in West and East Africa, across Ghana, Niger, Nigeria, Kenya, and Ethiopia. One interesting observation is the high number of desertification projects that also include a significant or principal relationship to gender.
In fact, across all projects, gender has been an increasingly important cross-cutting theme in the Rio markers, wherein about 41% of the total worth gender has played a significant role and a principal role in 3.2%. With a better understanding of linkages between gender and climate and a growing overlap in funding between the two, it will be interesting to see if the trends follow suit with the increasing realization of linkages between climate and prosperity of future generations.
Explore five years of climate funding data, put together by the Devex Analytics team, in this interactive visualization.
Do you want to know more about funders’ priorities regarding climate change? Reach out to our experts at analysts@devex.com.
About the author

Maja Wisenberger
Maja Wisenberger works in Devex's Analytics team in Manila, assisting in expanding data content and analyzing global funding trends. She has a master's degree in Public Policy from China and she brings experience from UNOPS, UN Women and the nonprofit sector. Her main areas of interest are poverty alleviation, economic and gender equality, and Chinese philanthropy.

