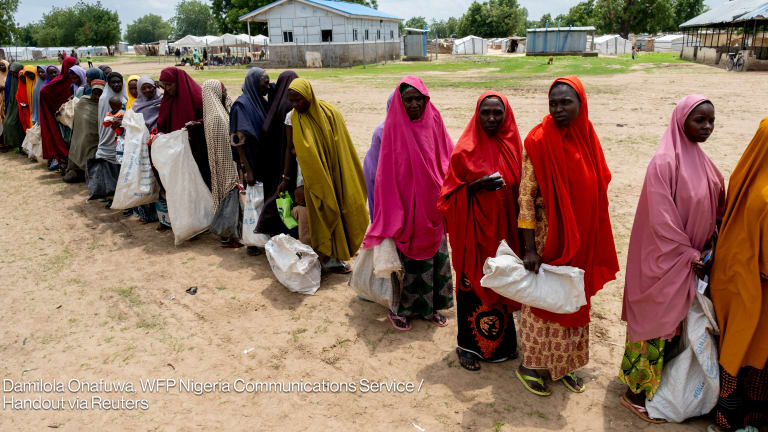
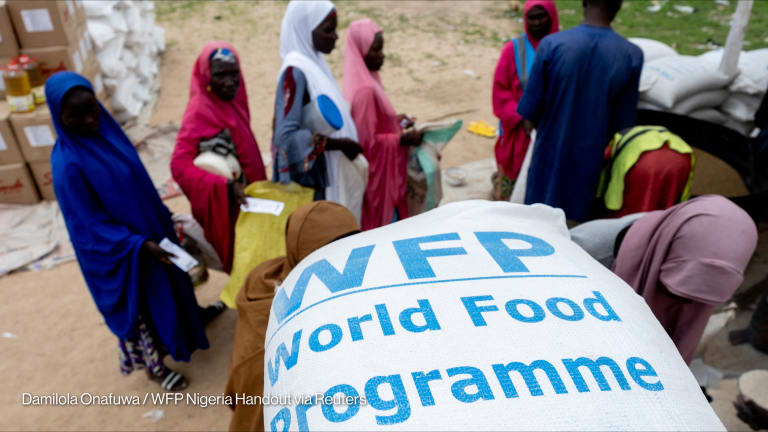
Who is funding food aid, and why should we be keeping track?
Across the world, millions are starving — and some hope data could help buck the trend.
In the center of a world map, Yemen — a country where 17 million people are food insecure — is colored with the darkest of blues. Across the Red Sea, Eritrea is a pale green. Further north, Jordan is a solid turquoise. And to the west, Ethiopia, Sudan, and Chad are a swath of navy. But the colors — at least in this visualization — aren’t measuring the food crises raging within each nation’s borders. Instead, they paint a picture of who is funding responses to those crises and how trends in financing have changed over time. It’s one of several layers of analysis published by the Global Alliance for Food Security, an initiative led by the World Bank and the Group of Seven major economies that aggregates data on food needs, preparedness, and response. GAFS is one of a handful of organizations trying to elevate the use of data for decision-making, especially as the world’s crises multiply. Yemen’s nearly black shade of blue illustrates that last year, the nation received more food assistance than any other country: Nearly $727 million went toward food aid in 2023, more than half of which came from the United States. Afghanistan follows close behind, with last year’s $640 million cloaking the country in the same deep shade of blue. At the most basic level, the colors show where funding is going and where it is not. Combined with the map’s other layers — which illustrate humanitarian needs, preparedness planning, and warning signs — the team behind GAFS hopes to paint a more informed picture of humanitarian response. And with it, they hope to save more lives by bringing about a more streamlined, collaborative, and informed way of delivering aid. “When it came to programming data — who is doing what, where — that information was scattered all over the place,” said Zacharey Carmichael, a senior economist at the World Bank and a member of the secretariat for the GAFS. “When you’re facing a food and nutrition security crisis, time is of the essence, and information is of the essence. But we’ve been dealing somewhat in a black hole here.” The World Bank isn’t the only one trying to fill the gaps. The Aid Transparency Index has tracked how the 50 largest aid organizations have reported their data — and dollars — for the past 12 years. It’s focused on how those agencies have submitted information to the International Aid Transparency Initiative, which has encouraged donors to upload data under a standardized, accessible format since its launch in 2008. The 2024 index, which was launched on Tuesday, included an additional section on food assistance for the first time — noting that the complications of war, climate change, and the COVID-19 pandemic elevated food needs to unprecedented levels. “If you step back and look at the world today, the needs are enormous. The budgets are not infinite. And the resources that we have need to be spent carefully,” said Sally Paxton, the United States representative of Publish What You Fund, the organization behind the Aid Transparency Index. “If you’re working in the dark, it’s impossible to ensure that you’re spending effectively.” Digging into the data The 2024 index found that the U.S. is, by far, the largest bilateral funder of both emergency and development food aid. The country spends 3 1/2 times more on food aid than Germany, the next largest donor — with 680 U.S.-funded, development-related food aid activities in 2023 alone. The report also includes the breakdown of those funds, with the World Food Programme taking home the vast majority of USAID food dollars. Last year, USAID provided WFP with $1.72 billion for emergency food assistance and $654 million for development food assistance, the report stated. “It really should be data for action and data for making change on the ground. … With this information, we can start to see the gaps within the system.” --— Zacharey Carmichael, senior economist, World Bank Catholic Relief Services, USAID’s second-largest food aid partner, trailed far behind, receiving $500 million for both types of assistance during the same period. The report also notes how U.S. emergency and development food aid differ. Emergency food assistance is often locally sourced, allowing for food to be purchased from producers in-country. It may also be given to communities through cash transfers. But development food assistance is typically provided in-kind, bought from U.S. farmers and shipped overseas. “While the amount of money the US spends on food aid is generous, it has been criticised for the way it is sourced and delivered,” the index states, explaining that shipping U.S.-grown food aid to fragile settings can disrupt local markets. The purpose of such tracking, Paxton explained, is not just to shine a light on where money is going. It’s to push organizations to be transparent about what they fund and ensure development and humanitarian projects are not happening in a vacuum. “We don’t want information to just be published. We want it to be used — as a management tool, with other donors, with policymakers, and with stakeholders,” Paxton told Devex. “We want everyone to have access to this information so that they can play their role in solving some of these enormous development problems that we have.” Data for what For Carmichael — along with the “army of people” working to keep the GAFS for Food Security’s platform alive — their ambitions are exactly the same. By tracking funding streams, preparedness levels, and crisis conditions, Carmichael hopes the world will make more timely, coordinated decisions about how to intervene when hunger strikes. “I’m a big proponent of data for what,” said Carmichael, speaking at the launch of the 2024 Aid Transparency Index. “It really should be data for action and data for making change on the ground. One of those action points is to say, with this information, we can start to see the gaps within the system. How do we fill those gaps, and how do we do it in a more systematic way?” One way that GAFS hopes to do that is through preparedness monitoring. Carmichael described how in 2009, there were more than 100 early warnings that Somalia was on the brink of famine — and by the time a famine was actually declared by 2010, half of the 250,000 that died from that particular crisis had already perished. “That’s the cost of delay,” Carmichael said. “And unfortunately, there’s still a tendency to act too late.” On the GAFS platform, countries are categorized in shades of red and blue to notate real-time food price inflation. Flip to a different layer, and you’ll see stretches of orange, red, and yellow across Africa, Asia, and the Middle East. Two deep red Xs — the symbol for famine risk — hover above the Gaza Strip. And on another map altogether, there are gradients of green, colors that showcase how countries are preparing for food security crises. That’s a separate, yet related, initiative led by GAFS, Carmichael explained, where the World Bank and several United Nations partners help prepare countries for food-related shocks. Today, 25 countries have committed to establishing those plans, and the green gradient map showcases how far those countries have gotten in the process. “It’s about being extremely detailed about how crisis risks are being monitored in a country, and how we convene the right people at the right time to make decisions,” he said. “Once that [plan] is out, we convene over the next number of days, make a decision, and decide if we need to scale up that type of action.” On this map, Somalia is colored the darkest: A pine green that denotes their preparedness plan has been finalized and endorsed.
In the center of a world map, Yemen — a country where 17 million people are food insecure — is colored with the darkest of blues. Across the Red Sea, Eritrea is a pale green. Further north, Jordan is a solid turquoise. And to the west, Ethiopia, Sudan, and Chad are a swath of navy.
But the colors — at least in this visualization — aren’t measuring the food crises raging within each nation’s borders. Instead, they paint a picture of who is funding responses to those crises and how trends in financing have changed over time.
It’s one of several layers of analysis published by the Global Alliance for Food Security, an initiative led by the World Bank and the Group of Seven major economies that aggregates data on food needs, preparedness, and response. GAFS is one of a handful of organizations trying to elevate the use of data for decision-making, especially as the world’s crises multiply.
This story is forDevex Promembers
Unlock this story now with a 15-day free trial of Devex Pro.
With a Devex Pro subscription you'll get access to deeper analysis and exclusive insights from our reporters and analysts.
Start my free trialRequest a group subscription Printing articles to share with others is a breach of our terms and conditions and copyright policy. Please use the sharing options on the left side of the article. Devex Pro members may share up to 10 articles per month using the Pro share tool ( ).
Elissa Miolene covers U.S. foreign assistance from Washington, D.C. She previously covered education at The San Jose Mercury News, and has written for The Wall Street Journal, the San Francisco Chronicle, and other news outlets across the world. Before shifting to journalism, Elissa led communications for aid agencies in the United States, East Africa, and South Asia.